[youtube=http://www.youtube.com/watch?v=iKKp9rAJSRE&w=420&h=315]
The book “The Most Powerful Idea in the World” by William Rosen chronicles the story of the steam engine and dives into the history of the influential figures that were needed to cause the invention explosion of the 18th century. Many steps needed to be taken such as developing a national responsibility for investment research and the right to own one’s own ideas (the first patent laws). Bill Gates, founder of Microsoft, believes the most important thing that pushed forward the invention of steam engine was new measurement tools. New ways of measuring energy output allowed inventors to see if new design changes led to actual improvements. Bill Gates has found, as he tries to improve the human condition around the world, if you find the right measuring tool you can achieve incredible progress towards your goals.
A proper measurement of your investments are no different. The better you are able to measure your performance the more likely you are to improve your investment experience. To do this we will discuss how to choose a proper benchmark for your investments.
Geography
Although it might sound obvious, you should start by selecting a benchmark that is similar to your investment’s geographical location. This would mean comparing US stocks to US stocks and Emerging Market stocks to Emerging Market stocks. Unfortunately many investors, including a newsletter many airline pilots receive, compare portfolios of stocks from around the world to the S&P 500, which is made up of US large cap stocks. During the “lost decade” for US stocks, 2000-2009, the S&P 500 had an annual return of -0.95% while the MSCI Emerging Market Index returned 10.11% per year. This is hardly a fair comparison.
Use Total Return (including dividends)
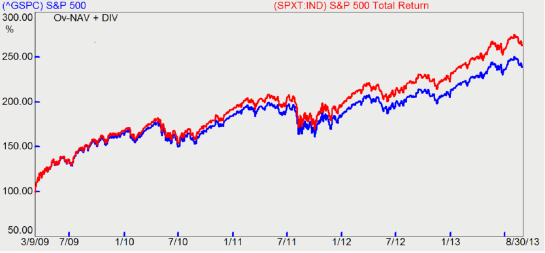
A trick used all the time by Wall Street is when “professional” investors compare their performance to an index that does not include dividends. To see this in action just watch CNBC for 15 minutes. Below is a chart of the S&P 500 price return only, which is always quoted on TV, versus the S&P 500 total return from the bottom of the market in March 2009 through August 2013. Dividends increased the return 24.07% over this time period. Unfortunately you will almost never see the total return figure quoted.
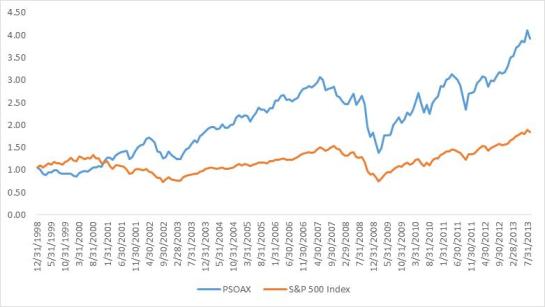
As we have discussed on this blog incorporating style premiums, such the value premium, can increase returns. Since this is well known to investors and includes additional risk factors, a proper benchmark should account for them. For example let’s look at the mutual fund PSOAX verses the S&P 500 from December 1998 through August 2013, the longest period for which we have data. Below is the chart comparing the total returns:

As you can see PSOAX performed much better than the S&P 500 total return over this time period. However, this turns out to be an unfair comparison because PSOAX is the JP Morgan Small Cap Value Fund. As the name implies it invests in small companies that have size and value premium characteristics. A better benchmark is the Russell 2000 Value Index. Below is a chart comparing total returns:

Suddenly the performance of PSOAX doesn’t look quite as good.
Regression Analysis
The best way to benchmark a portfolio is to use a mathematical tool known as Regression Analysis that, put simply, tells you how exposed a portfolio is to various risk factors and if there is any significant outperformance. Below is an example of a regression I did on the mutual fund above, PSOAX, versus various style premiums using monthly data from December 1998 through August 2013:

The first column shows the alpha, or outperformance, after taking into consideration exposure to style premiums and associated risk. It shows that there was a very small outperformance of 0.06% per month, but the T-Stat is only 0.41 which means it is not statistically significant outperformance. Normally an absolute value of at least 2 is needed for someone to label something statistically significant (>95% confidence level).
The next four columns show the style premiums we accounted for. They are:
- MKT-B – The market premium or the return of the entire stock market minus the risk free rate of return
- SmL – The size premium or the return of small of stocks minus the return of large stocks
- HmL – The value premium or the return of the stocks with high book-to-market (BTM) minus the return of stocks with low BTM
- WmL – The momentum premium or the return of stocks that have done well in the past year minus the return of stocks that have done the worst
The number below each factor shows how much of that factor PSOAX captures. So for example it captures 93% of the total market premium, 44% of the size premium and 71% of the value premium. The T-Statistics for all the factors are very high, indicating we can be very confident that PSOAX captures the total market, size and value premiums.
The adjusted R2 in the last column tells us how well these four factors explain the returns of the mutual fund. In this case they explain 90% of the funds return. This is shocking since this is an actively managed fund where the fund manager selects stocks they think will outperform. So after all the work they put into selecting stocks, 90% of the return is due to passive factors. The other 10% was from the fund manager’s stock picks, but the lack of alpha (just 0.06%) suggests they weren’t any better than investing passively in the market.
Regression Analysis can be used for a portfolio of individual stocks as well. All you need are the monthly returns of the portfolio and the monthly returns of the style premiums. You can download the returns of the factors at Ken French’s website (http://mba.tuck.dartmouth.edu/pages/faculty/ken.french/data_library.html). How to set up the Regression is beyond the scope of this article, but anyone with Excel can do it fairly easily.
Conclusion
When I ask most individual investors how they are doing, I normally get a vague response. Something like “I do OK. Sometimes I make money, sometimes I lose it.” Without using the proper measurement tools you don’t really know how well you are doing. Many professional investors are guilty of this as well. Over the years many have received credit for returns derived by gaining exposure to the additional risk factors above and called it alpha. Remember that proper measurement of performance will yield better performance.


