Author’s note: As some of my readers have pointed out, I have not written an article in a while. I have been busy with some new clients and other things, but mostly it is about getting out of the routine of writing these posts. Hopefully there will be a steady stream of articles you all find helpful in the future.
In my last article I talked about how the sequence of returns you get can be just as important, or even more so, than the total return of your portfolio. This becomes apparent when you take cash flows into account, like we did when we added money to your portfolio over time. Today we will take a look at spending down a portfolio, and how sequence of returns comes into play.
To do this let’s look at two different portfolios. Portfolio 1 will consist of only the S&P 500 (gross dividends). Portfolio 2 will consist of a mix of 50% Global Stocks represented by the MSCI All Country World Index (gross dividends) and 50% global bonds represented by the Barclays Global Aggregate Bond Index (hedged to the US dollar). Portfolio 2 will be rebalanced annually.
These are definitely two different portfolios, which will behave very differently. Depending on what time periods we study we can see much different results. For example, if we look at the time period from 2000-2014 Portfolio 2 did much better than Portfolio 1. If we look at 1995-2014 Portfolio 1 did much better. I think it is more interesting to look at times where the two portfolios had about the same total returns, so we can more clearly see what the impact of the sequence of returns make.
First let’s look at the time period from January 2002 to December 2014. Both portfolios had very similar returns. Portfolio 1 had an annualized return of 6.72% while Portfolio 2 had an annualized return of 6.63%. Below is a chart of both portfolios starting with $1,000,000 in January 2002.
As you can see Portfolio 1 had much more volatility over this time period (as we would expect). It had a much larger losses in the bad times, but had very good returns in the good times.
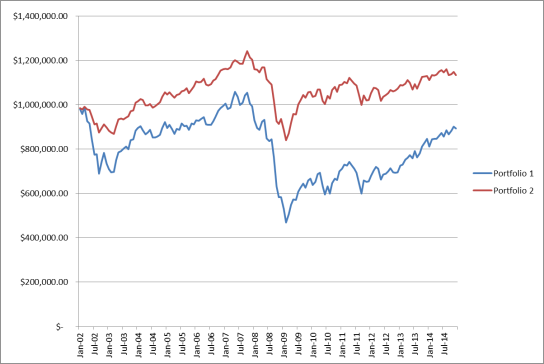
Now let’s add some cash flows to these returns. Instead of just investing our $1,000,000 and not touching it, let’s start taking money out to support retirement spending. Starting at the beginning of January 2002 we will make a monthly withdrawal of $4,166.67 ($50,000 per year) from our accounts. Each month we will slightly increase our withdrawal amount to be in line with inflation of 2% per year. Below is a chart of our account balances over time.
This chart looks a lot different than the last one. Even though both portfolios had the same total return, the less-volatile Portfolio 2 is superior over time. Having to withdraw money from our account during underperforming times makes it hard for the account balance to recover. There is just less money in the account to benefit from the good returns.
Let’s go back a little farther and look at another example when these two portfolios had similar returns. Below is a chart from January 1998 through December 2014. Again this chart is just investing our $1,000,000 all at once and not touching it.
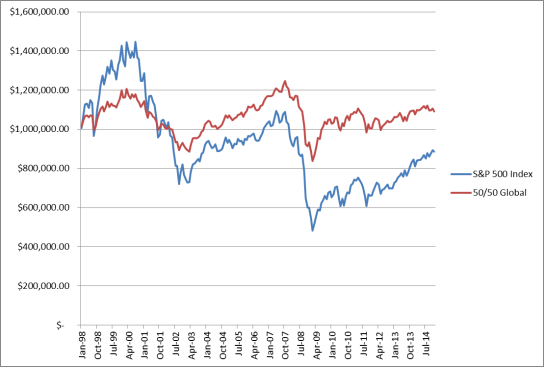
The difference over this time period is that there were really good returns over the first part of the time period for Portfolio 1. Now let’s do the same as before adding our retirement spending into the equation.
Even with the strong start, withdrawing money disproportionately impacts the more-volatile Portfolio 1. It is worth noting that over both time periods above the standard deviation of returns for Portfolio 1 was about 15% (Portfolio 2’s were about half that). Going back to 1926 the standard deviation of the S&P 500 was about 19%, so in some ways these time periods were less volatile for US stocks than average.
As you can see even with almost the exact same total returns, WHEN those returns happen is very important when you take into account cash flows – either going into, or out of, a portfolio. Of course, I could have found time periods that would make either portfolio the winner, but the whole point is to illustrate the importance of sequence-of-returns risk. This is precisely why I spend so much time creating portfolios with the lowest possible volatility for the amount of potential return – in general, the lower the volatility of a portfolio, the lower the sequence-of-returns risk.


