
This chart says it all for some people….
For the last 4 years US stocks has been the place to be and there is no reason certain folks see it changing for the foreseeable future. It is even looking like things are getting worse for the rest of the world. During the last half of 2014 the spread widened between the return of US stocks and stocks from the rest of the world. To put some numbers on it from January 2011 through December 2014 (the last 4 years) the S&P 500 has returned 15.55% per year – a total return of 78.28%! The rest of the world did much worse only returning 4.8% per year – a total return of only 20.63%.
If you owned a global portfolio you would have done somewhere in between, as the US stock market makes up about 50% of the global market, but you would still be underperforming the S&P 500. A global stock allocation made up of 50% S&P 500, 38% developed international stocks and 12% emerging market stocks (rebalanced annually) returned “only” 9.67% per year. However, compared to the S&P 500 on a total return basis it was about half – a total return of 44.67%.
Knowing this, is it time to give up on the global portfolio? Sure diversification is great and owning stocks from around the world gives you more diversification than only 500 US-based companies, but at some point don’t you have to go with what is working and abandon your strategy?
One thing we can do is look back at history to see how a global stock portfolio stacks up against the S&P 500. We have good data on developed international stocks going back to 1970 and on emerging market stocks back to 1988. Our global portfolio will consist of 50% S&P 500 and 50% MSCI EAFE (developed international stocks) from 1970 through 1987. Starting in 1988 we will include emerging market stocks. Our global portfolio will then consist of 50% S&P 500, 38% MSCI EAFE Index and 12% MSCI Emerging Market Index. These are the current weightings of a global portfolio.
A Look At History
1970-1974

It looks like the global stock market did a little bit better in the early 70’s, although neither did very well. The S&P 500 had a total return of -11.21% with the global portfolio having a total return of -1.28%. Winner – global portfolio. I guess the global portfolio is doing a little better so I will stick with what’s working.
1975-1979

In the late 70’s the stock markets recovered, but the global portfolio finished the decade strong. I was pretty disappointed in my decision to stick with the global portfolio the first couple of years, but it turned out OK. The S&P 500 had a total return of 99.08% and the global portfolio had a total return of 124.03%. Winner – global portfolio. It looks like the global portfolio is still the place to be.
1980-1984
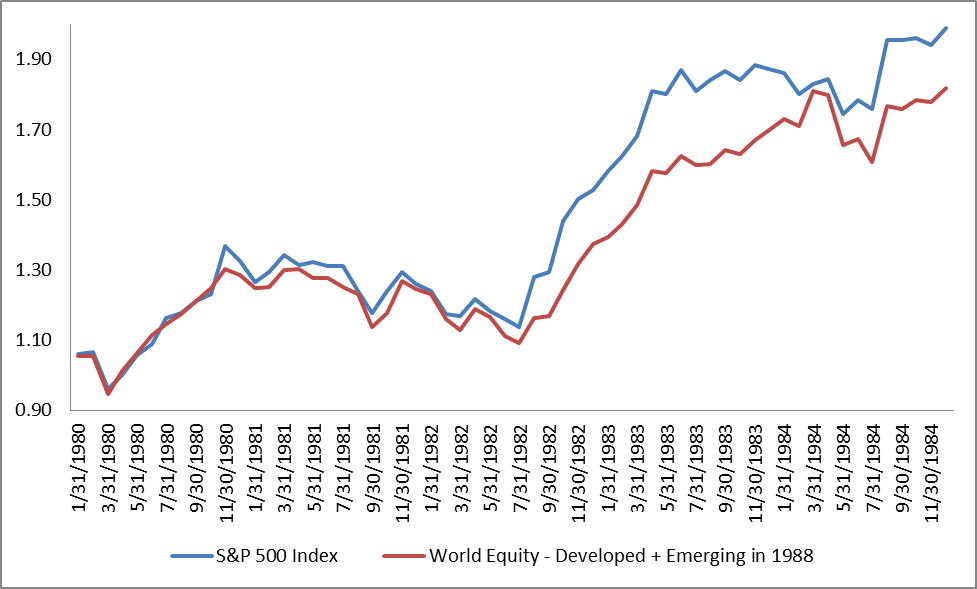
In the early 80’s stocks had another good period. The total return of the S&P 500 was 99.02% and the global portfolio returned 81.78%. Winner – S&P 500. I wasn’t too upset with my decision at first, but maybe I made the wrong one…
1985-1989

In the late 80’s all stocks had wonderful returns, but the global portfolio did much better. The total return of the S&P 500 was 153.08% and the global portfolio was 279.78%! Winner – global portfolio. That’s an annual return of 30.59% for the global portfolio. It’s a good thing I continued my strategy of owning a global, diversified portfolio. (Fun fact: a $100,000 portfolio getting 30.59% per year for 30 years would create a portfolio of over 300 MILLION dollars!)
1990-1994

The global portfolio definitely let me down in the beginning of the 90’s, but had great returns the last two years. The total return of the S&P 500 was 51.74% and the Global Portfolio was 47.24%. Winner – S&P 500. Although the S&P 500 won this period, it won by less than 1% annually. I’ll stick with the global portfolio.
1995-1999

Stocks had a great run in the late 90’s. The total return of the S&P 500 was 251.12% and the global portfolio had a total return of 149.98%. Looks like I may have made the wrong choice – I feel like the only one not making any REAL money.
2000-2004

Well that dot-com bubble bursting was painful! The early 2000’s was a tough year for stocks. The total return for the S&P 500 was -10.98% and the total return of the global portfolio was -3.46%. I don’t feel too bad since the global portfolio lost about 40% too, but it looks like the global portfolio is having a better recovery.
2005-2009

You see this asset allocation stuff is easy. It was a good call sticking with that global portfolio for this period. The total return of the S&P 500 was 2.11% and the total return of the global portfolio was 21.31%. It was another scary period for stocks, but at least I had some return by sticking with the global portfolio. In fact the total return over the last 10 years for the S&P 500 was -9.10%. US stocks couldn’t get a positive return for 10-year stretch!
2010-2014

Looks like I was wrong again: the total return was 105.14% for the S&P 500 and 63.41% for the global portfolio. Should I finally switch to the S&P 500 since it has been doing so well?
Over the last 45 years it turns out that going with what has been doing well lately is NOT a good strategy.
Full Period 1970-2014

Since 1970 it looks like the global portfolio was the place to be. The S&P 500 had a total return of 8,745.4% and the global portfolio had a total return of 10,654.29%. If you look at the returns on an annualized basis it is a much closer comparison. The S&P 500’s annualized return was 10.47% and the global portfolio’s annualized return was 10.95%, showing what a small increase in return can do over a long period of time.
Even though the global portfolio had a slightly better performance over this particular 45-year period it is NOT the reason to own it. The reason is diversification. It seems like the risk premium in stocks is the same around the world (maybe a bit higher in emerging markets). The problem is we just never know when those risks are going to show up in different parts of the world. Japan’s large cap stocks are in the midst of a 27-year period with negative returns. Just like investors around the world, Japanese investors have a home-country bias. It hasn’t worked out so well for them after it looked like they were going to take over the world in the mid 80’s.
A key point to remember is that markets don’t price growth, they price risk. What I mean is that just because it seems the US is going to grow faster than the rest of the world this year, it tells us nothing about its relative performance in stocks. The stock market has priced US stocks with certain expectations and the rest of the world with others. Depending on how reality matches those expectations will determine how the markets do. US companies may continue to have great earnings with forward guidance above what is expected. International companies may continue to lag or even get worse. Of the course the opposite may be true as well.
As we saw in the above example, looking at what has been working lately is a horrible predictor for what will happen in the future. It turns out this is true for almost any decision, whether it’s that hot stock or great mutual fund. We just can’t buy yesterday’s returns, only tomorrow’s.