If you are a regular reader of my newsletter you know that I try to build portfolios that gain exposure to sources other than traditional stock and bond returns. If fact, I believe that most people’s portfolios are dominated by one single source of risk, beta, or the risk of the stock market as a whole. Further, I believe most people are too bias towards their home country, which for us means too much concentration in US stocks. If you take the idea of spreading out risk to the extreme, you will build a portfolio that equally balances the risks within that portfolio so no one type of risk dominates the portfolio. This idea is commonly called risk parity, which we will look at deeper today.
What is the problem with traditional portfolios?
In my last post I looked at a new mutual fund from AQR and how it can improve upon a portfolio of stocks and bonds. To do this I compared a portfolio of 50% stocks and 50% bonds to a portfolio of 34% stocks, 33% of bonds and 33% of the new fund QSPIX. As we saw in the last post, over the past year we were able to reduce the volatility of the portfolio while increasing the return. However, the returns were still dominated by the stock portion of the portfolio. In fact the stock portion was able to explain about 72% of the portfolio’s return. Today we will use a similar example, but switch to indexes (and back testing in the case of QSPIX) to look at some hypothetical portfolios over a longer period.
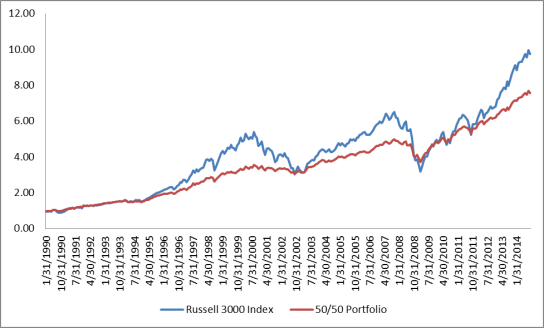
First let’s look at a portfolio that is made up of 50% Russell 3000 index and 50% Barclays US Aggregate Bond Index (rebalanced annually) compared to the Russell 3000 index itself. (Note: All portfolios today run from January 1990 through September 2014)
These two portfolios basically move in the same direction, only the 50/50 portfolio has less volatility. If we run a regression using the Fama/French Total US Market Research Factor (basically the return of the US stock market minus the risk free rate) we can see that 93% of the return of the 50/50 portfolio can be explained by the exposure to stocks.
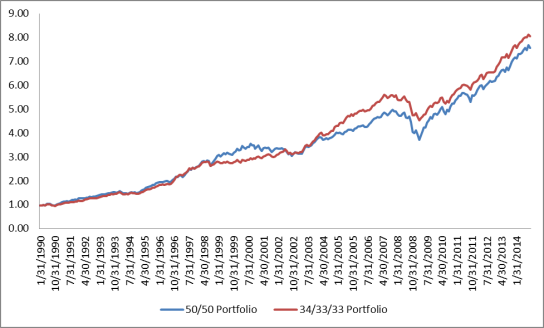
Just like in the last article, let’s add another asset to the mix. We will add the back tested data for QSPIX, which captures premiums separate form stock and bond risk. Therefore, it should be an uncorrelated stream of returns from our first two assets. Our new portfolio is 34% Russell 3000 Index, 33% Barclays US Aggregate Bond Index and 33% and 33% back tested QSPIX.
 As we would expect, adding an additional uncorrelated asset lowered the volatility of the portfolio and the amount of return for each unit of risk increased.
While our new portfolio is superior to the 50/50 portfolio it is still dominated by the risk of stocks. Running the same regression as above, 63% of the return of our 34/33/33 portfolio can still be explained by the exposure to stocks. How can this be if we allocated equally to each asset class? We can find the answer by looking at each asset individually.
As you can see from the chart above, the Russell 3000 index is much more volatile than the other two assets. So in our 50/50 portfolio, even though we allocated equal parts of both assets, the allocation to the Russell 3000 Index is so much more volatile it dominates the risk of the portfolio.
Enter Risk Parity
So far we have learned that if you want to have a portfolio that is not dominated by a single asset class you have to go farther than just equally allocating dollar amounts to each asset. To find the true risk parity portfolio it is a rather involved calculation using multiple variables witch include the correlations of each asset. A simpler approach (sometimes referred to as the naïve risk parity portfolio in academic papers) can be solved with a much simpler formula.
Basically we will take the inverse of the standard deviation for each asset and divide that by the sum of the inverse standard deviations of all the assets. This will tell us the weight of each asset to make our risk parity portfolio.
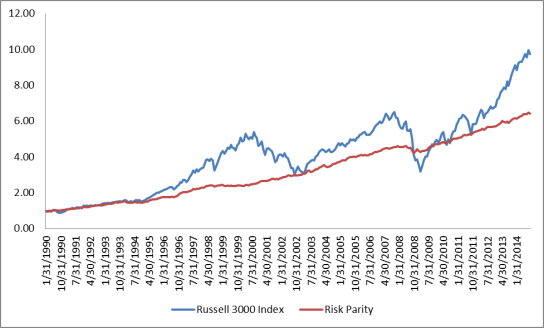
When we do this we get a truly balanced portfolio giving equal parts of risk to the portfolio instead of equal dollar amounts. This formula tells us that our risk parity portfolio will consist of 15% Russell 3000, 62% Barclays US Aggregate Bond Index and 23% back tested QSPIX. (A more complex calculation would give us weights of about 16/60/24)
 As you can see the Risk Parity portfolio does not move in lock step with the Russell 3000 Index. If we run the same regression we ran above on the risk parity portfolio we can see that only 32% of the return of our portfolio can be explained by the exposure to stocks, which is what we would expect. We can also see that the Risk Parity Portfolio has a much higher risk/return profile than our other two portfolios we built today, although the return is lower.
What’s not to love about Risk Parity?
The whole idea of having your assets have equal parts risk within a portfolio makes perfect sense if you want a truly diversified portfolio. Of course we were cheating in these examples, since we were looking back into the past and building portfolios knowing the future. If we were to attempt to build a risk parity portfolio today it is unclear that these would be the correct weights since we don’t know the future volatility of each asset class. Although volatility is more easily predictable than returns, volatility can change rapidly and requires a portfolio manager of a risk parity portfolio to be constantly updating portfolio weights to keep true risk parity. Stocks, for example, can go (and have gone) through long periods of low volatility followed by sharp increases in volatility. Bonds over this particular time period have been great investments, having high returns with low volatility. What would happen if bond yields suddenly shot up and caused the volatility of your bond holdings to increase rapidly? That large allocation to bonds would have to be quickly reallocated to keep equal risk exposure.
Another problem lies with the relatively low returns of risk parity portfolios. As I mentioned above this was a great time for bond returns, returning 6.48% per year. From these bond yields it is pretty much mathematically impossible to duplicate these returns over the next 10 years. Most people would expect this bond index to return closer to 2% per year going forward. Also, most academics believe the best estimate for the returns of US stocks is around 8% per year. Additionally I believe the expected return of QSPIX is around 7% per year. Using these estimates our risk parity portfolio has an expected return of around 4%. The way current portfolio managers of risk parity portfolios get around these low returns is to use two dirty words in finance – leverage and derivatives. In order to increase the returns of risk parity portfolios to a return palatable to most investors, portfolio managers must either lever the entire portfolio or use derivative instruments, such as futures, to lever each individual piece of the portfolio. While there is nothing necessarily wrong with adding leverage to a low risk portfolio, it adds another element of risk which must be closely managed. If we were to lever this portfolio 300% we could potentially have a portfolio with a 12% expected return (less the cost of leverage) with a standard deviation of only 13%. This would be a great result that any investor should be thrilled about (especially in this low yield environment).
Unfortunately this is just a fact of life in investing. If you want high returns you either have to lever a diversified portfolio or concentrate your risk into riskier investments (or hope you get lucky). While I don’t personally subscribe to the idea of investing in levered risk parity portfolios, understanding how they work gives us a better idea of what we actually own inside our portfolios.
An Aside
Today we used our three assets (stocks, bonds and alternative style premiums) to build a risk parity portfolio; however, in practice most risk parity portfolios define risks differently. They usually use the risks of stocks, bonds, and inflation linked assets (such as commodities and TIPS) and balance those risks. The idea is that you are protecting yourself from inflation and deflation, while being exposed to global growth. Other portfolios define the risks in other ways, but none that I know of use alternative style premiums as a separate source of risk to be balanced (but maybe they should!).


